

India’s Richest City by GDP 2025: Mumbai at $310B, Top 10 Ranked
 India's Richest City by GDP 2025: Mumbai at $310B, Top 10 Ranked
Estimated reading time: 8 minutes
Thank you for reading this post, don't forget to subscribe!India’s Richest City by GDP in 2025: Mumbai at $310B
Bigger ports, buzzing stock tickers, and packed tech parks, that is the picture of India’s city economies in 2025. The short answer you came for: Mumbai is India’s richest city by GDP in 2025, followed by Delhi NCR. This guide gives you the full top 10 with figures, why it matters, and how we arrived at these numbers.
GDP means the value of goods and services made in a place in a year. A city’s GDP shows total size, not average income or living costs. The figures here are the latest available estimates for 2025 in USD.
Here is what you will get below: Mumbai’s win, the 2025 ranking with a clean table, why Mumbai leads, how other cities power growth, and a transparent method section you can trust. Skim the table, then jump to the parts you need.
Richest city in India by GDP in 2025: Mumbai ($310 billion)
Mumbai ranks first in 2025 with an estimated GDP of $310 billion. It holds the top spot because it is India’s financial capital with big ports, strong services, a huge media base, and deep real estate markets. The runner-up is Delhi NCR at $293.6 billion, very close behind. This matters for you because jobs, business opportunities, trade links, and investment flows tend to follow big city economies.
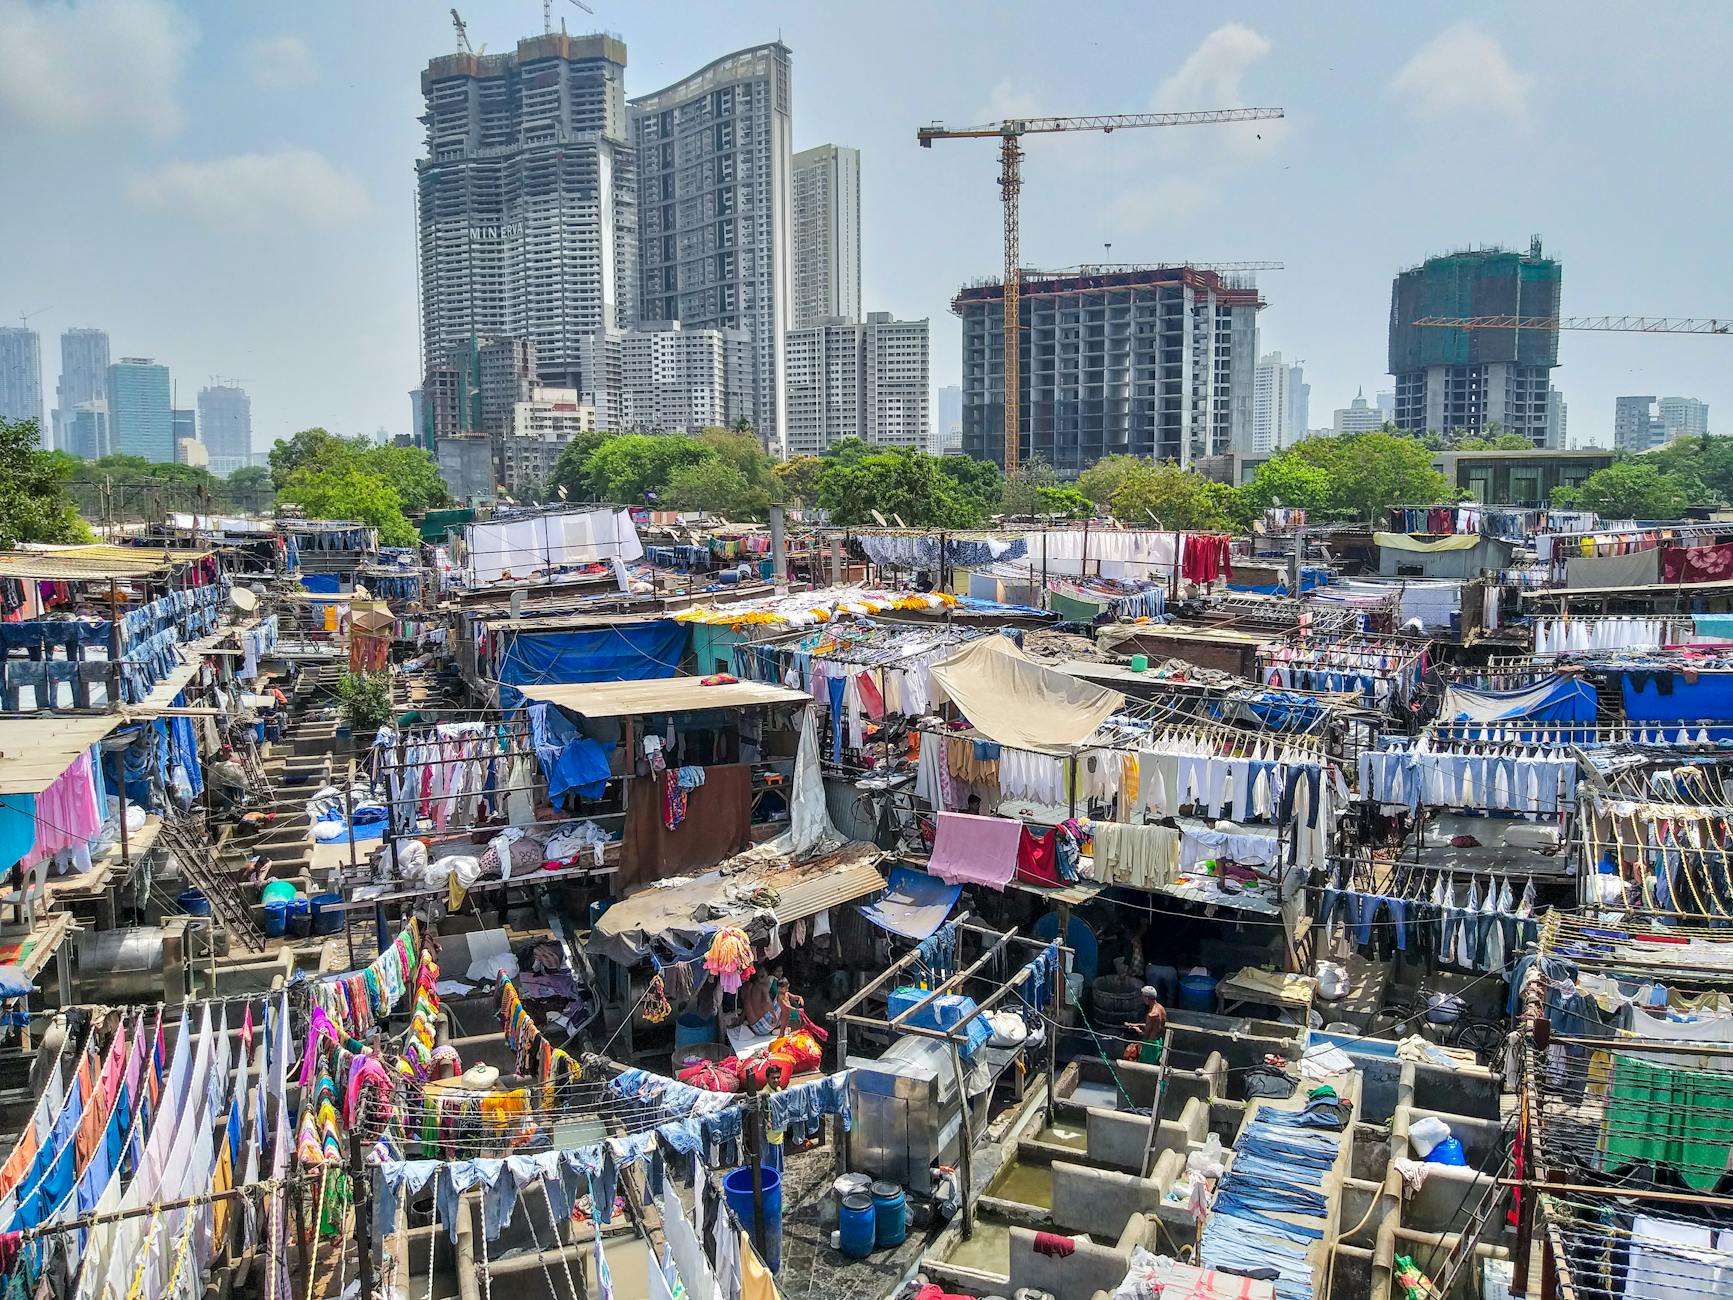
Photo by Mohamed Regaieg
Quick facts: what powers Mumbai’s GDP
- Finance and markets, anchored by BSE and NSE
- Ports and foreign trade through Mumbai Port and JNPT
- Film and media, led by Bollywood and TV networks
- Corporate headquarters and professional services
- Real estate and construction across office and housing
- Strong retail and consumer services
These sectors feed each other, so the city’s output stays high year after year.
Mumbai vs Delhi NCR: who is close behind
Mumbai stands at $310 billion. Delhi NCR follows at $293.6 billion in 2025. Mumbai’s strengths are finance, trade, and media. Delhi’s strengths are government, services, IT, telecom, retail, and manufacturing. NCR includes Gurugram and Noida, which raises its total. Both anchor India’s economy, but their engines are different.
Top 10 richest Indian cities by GDP in 2025 (with figures)
| Rank | City | GDP (USD billions) | Key drivers |
|---|---|---|---|
| 1 | Mumbai | 310 | Financial capital, stock exchanges, ports, media, real estate |
| 2 | Delhi (NCR) | 293.6 | Government hub, IT, telecom, banking, retail, manufacturing, tourism |
| 3 | Kolkata | 150 | Port city, manufacturing, steel, tea, jute, textiles |
| 4 | Bengaluru | 110 | IT and startups, aerospace, biotechnology |
| 5 | Chennai | 78.6 | Automobiles, manufacturing, IT, port trade |
| 6 | Hyderabad | 75 | IT, pharmaceuticals, biotechnology |
| 7 | Pune | 69 | Education, R&D, IT, manufacturing, auto |
| 8 | Ahmedabad | 68 | Textiles, chemicals, gems, petrochemicals |
| 9 | Surat | 59.8 | Diamond cutting, textiles, trade |
| 10 | Visakhapatnam | 48.5 | Port services, petrochemicals, heavy industry |
The list shows a mix of finance, tech, manufacturing, trade, and port activity driving city-scale output.
For another view of metropolitan GDP, see the broader reference on Indian metropolitan areas by GDP. You can also compare these numbers with a recent rundown of 2025 city projections on ThinkWithNiche’s top 10 cities by GDP.
How to read the ranking and what the numbers mean
These are city or metro GDP estimates in nominal USD for 2025, so exchange rates can affect the dollar totals. Rankings can vary a little by source, but the picture is stable: Mumbai and Delhi lead, followed by major tech and industry hubs. GDP shows total output, not quality of life.
One-line growth drivers for each city
- Mumbai: finance, ports, media, corporate HQs, and large real estate
- Delhi NCR: government center with IT, telecom, banking, retail, and industry parks
- Kolkata: port-led manufacturing plus steel, tea, jute, and textile chains
- Bengaluru: software giants, startups, aerospace work, and biotech labs
- Chennai: auto plants, components, manufacturing clusters, and port trade
- Hyderabad: IT corridors with pharma and biotech production
- Pune: universities, R&D, auto engineering, and IT services
- Ahmedabad: textiles, chemicals, and petrochemical base with skilled supply chains
- Surat: diamond cutting power and large textile hubs
- Visakhapatnam: port services tied to petrochemicals and heavy industry
If you want another summary list to cross-check, this brief guide on the richest cities in India in 2025 offers a readable overview.
Why Mumbai leads in 2025: finance, ports, media, real estate
Money moves through banks and markets, goods move through ports, stories flow through studios, and people spend on homes, shops, and services. Together they create a loop that keeps Mumbai’s economy busy, diverse, and resilient.
Financial center and markets
Mumbai is home to major banks, insurers, mutual funds, and investment firms. The Bombay Stock Exchange and the National Stock Exchange sit at the heart of daily trading. Listings, equity trades, bond issues, and deal-making add to services output. They create demand for law, audit, consulting, data, and tech jobs across the city.
For broader context on how lists peg city GDP, compare the finance-heavy Mumbai profile with independent breakdowns like this 2025 richest cities list.
Trade and logistics through Mumbai Port and JNPT
Container ships line up, cranes swing, and trucks clear cargo across vast yards. The two big gateways, Mumbai Port and JNPT, feed wholesale markets, warehousing, trucking, and customs services. Efficient logistics links local manufacturers and traders with global buyers. That pulls in revenue, supports jobs across the supply chain, and lifts city GDP.
Media and entertainment economy
Bollywood’s reach is global, and its local footprint is wide. Studios, production houses, TV channels, music labels, ad agencies, and streaming work all cluster here. Film shoots and events bring crews, designers, set builders, and hospitality teams into the mix. The spillover touches fashion, retail campaigns, and tourism, which keeps the services engine running.
Property, services, and consumer spending
High demand for offices, homes, and retail space keeps construction busy. White-collar jobs support dining, shopping, and leisure across neighborhoods and malls. Professional networks and deep talent pools make it easier for firms to scale. That stability helps Mumbai maintain first place.
If you want another angle on city-by-city strengths, this snapshot of the richest Indian cities in 2025 helps frame sector mixes and historic trends.
How other top cities create wealth in 2025
Delhi NCR: government, services, and airports
The center of government and embassies anchors demand for services, security, and logistics. Large IT, telecom, banking, and retail firms operate across Gurugram and Noida. Manufacturing parks and back offices add depth. The metro and Indira Gandhi International Airport shorten the distance between clients and markets.
Bengaluru: tech capital with aerospace and biotech
A deep tech base runs from software giants to a lively startup scene. Aerospace research and biotech labs add high-value work. Strong engineering colleges feed the talent pipeline. Global firms set up here to tap skills and steady delivery.
Chennai and Hyderabad: autos, pharma, and IT strength
Chennai hosts auto plants, components makers, and port-linked manufacturing. IT services continue to grow with strong export work. Hyderabad’s IT parks, pharmaceuticals, and biotech thrive on research, scale facilities, and steady global demand. Both cities combine plant output with high-skill services.
Western industrial belt: Pune, Ahmedabad, Surat
Pune blends universities, R&D, auto engineering, and IT campuses. Ahmedabad builds on textiles, chemicals, and petrochemicals, backed by supply chain depth. Surat shines in diamond cutting and textiles, with fast-moving trade networks. Shared skills and supplier clusters keep costs in check and output high.
East coast growth: Kolkata and Visakhapatnam
Kolkata pairs port access with steel, jute, tea, and textile lines. The city’s wholesale and retail markets amplify factory output. Visakhapatnam grows through port services, petrochemicals, and heavy industry links. Ports across the east lift jobs from docks to trucking to repair yards.
Methodology and sources: city GDP, definitions, and caveats
Figures are 2025 estimates in nominal USD for cities or metro areas. Delhi values refer to the National Capital Region, which includes nearby cities. Different sources can report slightly different totals due to methods and exchange rates. For cross-checking and wider context, reference public aggregates like the List of Indian metropolitan areas by GDP and summary explainers such as Top 10 Cities in India by GDP in 2025. Check the table above for the exact figures used in this post.
What is GDP and why it matters
GDP is the total value of goods and services produced in a place in a year. Big city GDP often signals deeper job markets, broader business demand, and higher infrastructure needs. It helps investors, students, and job seekers weigh options.
City vs metro area (and what counts for NCR)
Some figures refer to city limits, others to the urban agglomeration or metro area. Delhi NCR counts Gurugram and Noida, which raises its total. Always read how each source defines the city.
Nominal GDP vs PPP and currency effects
The table uses nominal USD. Dollar totals move with the rupee’s exchange rate. PPP adjusts for price levels, but it is not used here.
Limits of the data and how to use this list
- Estimates vary by source and may be revised
- The informal economy is hard to measure
- Exchange rate swings can shift USD totals
Use the ranking as a guide to city scale, not a measure of wages, prices, or living standards.
Conclusion
Mumbai is India’s richest city by GDP in 2025 at $310 billion, with Delhi NCR close behind. The table highlights how each major city runs on its own engine, from finance and ports to IT, autos, pharma, and heavy industry. Expect steady growth where these engines stay strong and keep adding skills, capital, and infrastructure. Save the table, share it, or use it for study, job planning, or business research. Big city GDP shapes where opportunities gather, so use it wisely.